Understanding Trading View: Features and Benefits
In today’s fast-paced financial markets, having access to comprehensive, real-time data and advanced analytical tools is essential for traders and investors alike. One platform that stands out in this arena is trading view. Renowned for its powerful charting capabilities, social trading features, and vast market coverage, Trading View has transformed how market participants analyze and interact with global markets. This detailed exploration will delve into the platform’s key features, its advantages for different trading styles, and how it empowers users to make informed decisions.
Key Charting Tools and Indicators
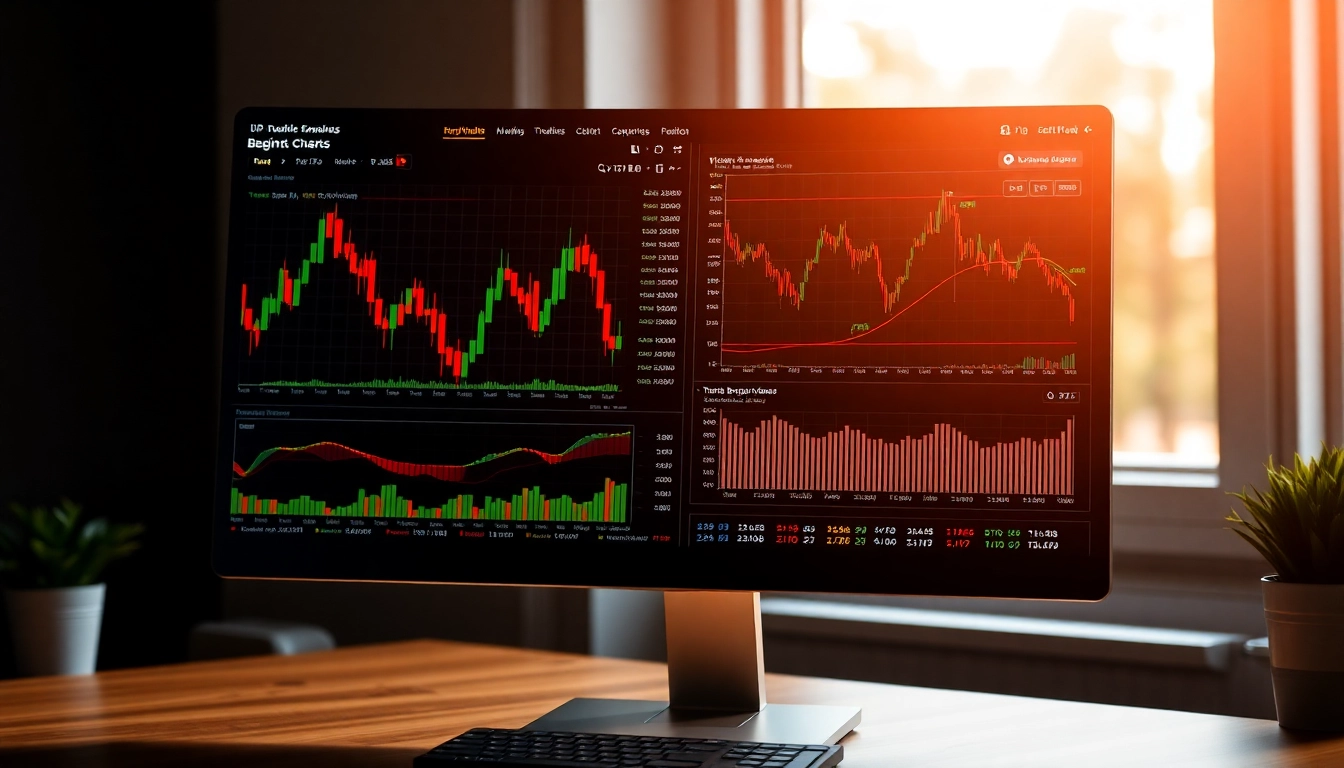
At the heart of Trading View lies its sophisticated charting tools that cater to both novice and expert traders. The platform provides a highly customizable chart environment, allowing users to choose from a variety of chart types, including line, bar, candlestick, and Heikin-Ashi charts. Advanced tools such as volume profiles, Fibonacci retracements, and Elliott Wave analysis further enhance the analytical toolkit.
Indicators form an integral part of technical analysis, and Trading View offers an extensive library—over 100 embedded indicators, including moving averages, RSI, MACD, Bollinger Bands, and Ichimoku Clouds. Users can also develop and implement custom indicators using Pine Script, a proprietary scripting language that enables automation and tailored strategies, thereby elevating the analytical depth.
Social Community and Idea Sharing
Beyond charting, Trading View is widely appreciated for its vibrant social community. Traders and investors share their ideas, charts, and trading strategies through the platform’s social feed, fostering a collaborative environment. This feature not only democratizes market insights but also enables members to learn from diverse perspectives across different asset classes—from cryptocurrencies to equities and commodities.
Community-generated ideas often serve as a valuable resource for identifying emerging market trends or validating trading setups. The platform’s ability to facilitate discussions and real-time analysis turns it into a powerful educational and networking tool that keeps traders updated with the latest market sentiment and innovative approaches.
Supported Markets and Real-Time Data
One of Trading View’s standout features is its vast market coverage. Users can access real-time data across multiple asset classes such as stocks, cryptocurrencies, forex, commodities, and indices. The platform aggregates data from numerous exchanges worldwide, ensuring traders have a comprehensive view of global markets.
Highlights include seamless integration with major exchanges and the capability to observe live price movements, set alerts, and follow news feeds relevant to specific assets. This real-time access facilitates timely decision-making, crucial for trading strategies that rely on rapid market fluctuations.
Getting Started with Trading View
Setting Up Your Account and Watchlists
Getting started is straightforward. Users can create a free account using email or social media credentials. Once registered, establishing watchlists allows traders to monitor selected assets effortlessly. You can categorize your watchlists based on asset classes, trading strategies, or market sectors, enabling rapid access to pertinent data during busy market hours.
Pro traders often utilize multiple watchlists to separate speculative trades from long-term investments, enhancing focus and organization.
Customizing Charts for Your Trading Style
Customization is key to leveraging Trading View’s full potential. Traders should tailor their chart settings to match their preferred trading style—whether day trading, swing trading, or long-term investing. Adjusting timeframes, indicator overlays, color schemes, and annotation tools can improve clarity and speed in analysis.
For example, scalpers may prefer short-term minute charts with multiple indicators, while investors might use daily or weekly charts combined with fundamental overlays for broader insights.
Installing Mobile and Desktop Applications
To ensure constant access, Trading View offers robust mobile apps for iOS and Android, as well as desktop versions for Windows and Mac OS. These applications sync seamlessly with the web platform, allowing traders to review charts, receive alerts, and execute trades on the go. Installing these tools is essential for active traders who need timely updates and flexibility.
Advanced Trading View Techniques for Traders
Utilizing Technical Analysis Tools Effectively
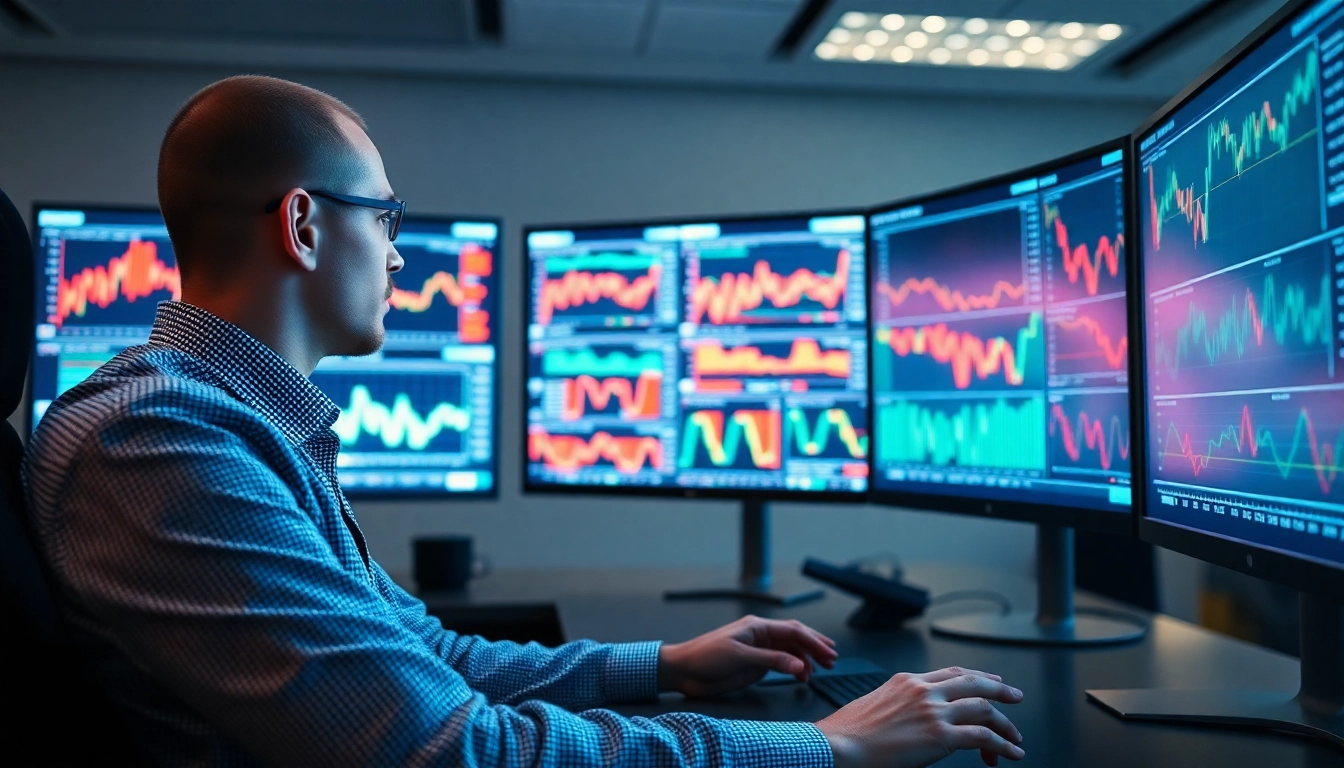
Expert traders leverage Trading View’s advanced tools to discern subtle market signals. Techniques include pattern recognition (head and shoulders, double tops/bottoms), divergence analysis, and multi-timeframe comparisons. Integrating indicators such as VWAP or Pivot Points can further enhance entry and exit decision precision.
Developing proficiency in combining multiple tools helps filter false signals and improves trade accuracy significantly.
Creating Custom Alerts and Automated Strategies
Automation is vital for efficient trading. Trading View allows users to set custom alerts based on price levels, indicator crossovers, or pattern formations with email, SMS, or app notifications. This ensures timely responses to market shifts without constantly monitoring screens.
For more automation, traders utilize Pine Script to develop strategies and backtest them against historical data, optimizing parameters before deployment in live trading environments.
Integrating Trading View with Trading Platforms
Though primarily a charting platform, Trading View interfaces with popular brokerage accounts via API integrations or third-party add-ons. This facilitates a streamlined trading workflow, executing orders directly from charts or alerts.
Traders should verify compatibility with their broker and ensure that their risk management protocols are integrated into the automated setups for safer trading.
Optimizing Market Analysis with Trading View
Interpreting Chart Patterns and Signals
Mastery of chart patterns—like flags, pennants, and triangles—can provide early indications of potential trend continuations or reversals. Combining these with volume analysis and oscillator indicators enhances predictive accuracy.
Consistent practice with pattern recognition on Trading View’s charts, coupled with historical performance tracking, boosts decision confidence.
Using Trading View for Risk Management
Risk management is critical. Setting stop-loss and take-profit levels directly on charts helps in disciplined trading. Trading View’s alerts can notify traders when an asset hits predefined levels, preventing emotional trading decisions.
Additionally, analyzing drawdowns and profit/loss metrics using platform tools allows for continual performance review and strategy refinement.
Tracking and Analyzing Performance Metrics
Consistent evaluation is key. Trading View’s built-in portfolio tracker offers insights into overall trading performance, winners, losers, and risk-reward ratios. Keeping records and analyzing these metrics helps identify behavioral biases and improve future strategies.
Future Trends in Trading View Innovation
Emerging Features and Updates
Trading View continually progresses by integrating new features like enhanced social collaboration tools, improved charting capabilities, and expanded assets coverage. Upcoming updates focus on making analysis more intuitive and accessible, regardless of experience level.
Leveraging AI and Machine Learning Tools
Artificial Intelligence (AI) and machine learning are increasingly integrated into charting platforms. Trading View is exploring predictive analytics, pattern recognition automation, and sentiment analysis powered by AI, providing traders with deeper insights and faster decision-making tools.
Enhancing Collaborative Trading Experiences
Future developments aim at more seamless social interactions—live chart sharing, collaborative analysis sessions, and community-driven trading signals—making Trading View not just a technical tool but a holistic trading community platform.